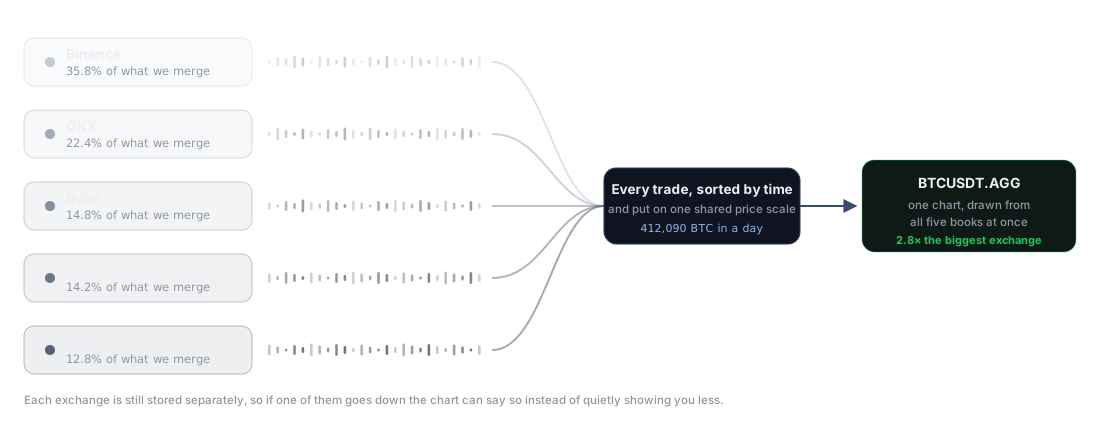
The trades are put back in the order they happened.
Five connections over five networks do not arrive in the order things happened. Prints are held for a moment and released oldest first, so a running total is running over a stream that is genuinely in sequence rather than in the order your router felt like.
The five are put on one price scale.
At any instant the exchanges quote a few dollars apart. Added up raw, a single price level smears across two rows and the busiest price on your chart lands somewhere nothing actually happened. The offset is measured from live quotes and applied when the ladder is built. Stored executions are never rewritten.
No single exchange owns the candle.
A liquidation cascade on one venue, or one thin book at three in the morning, must not become the market's high. The bar is priced from the exchanges that were actually quoting, so a wick has to be real before it appears.
A venue only joins if a hole in it can be refilled.
The admission test is not volume, it is whether the exchange serves an arbitrary historical range over its public API. Two larger venues are left out because they publish only the last few hundred prints, and a gap there could never be repaired. Where flow was not collected the chart says so instead of drawing a quiet market.